Manifold Learning
Nonlinear dimensionality reduction.
Inputs
Data: input dataset
Outputs
Transformed Data: dataset with reduced coordinates
Manifold Learning is a technique which finds a non-linear manifold within the higher-dimensional space. The widget then outputs new coordinates which correspond to a two-dimensional space. Such data can be later visualized with Scatter Plot or other visualization widgets.
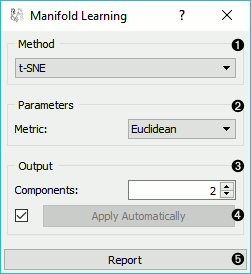
Method for manifold learning:
Set parameters for the method:
t-SNE (distance measures):
Euclidean distance
Manhattan
Chebyshev
Jaccard
Mahalanobis
Cosine
MDS (iterations and initialization):
max iterations: maximum number of optimization interactions
initialization: method for initialization of the algorithm (PCA or random)
Isomap:
number of neighbors
Locally Linear Embedding:
method:
standard
modified
local
number of neighbors
max iterations
Spectral Embedding:
affinity:
nearest neighbors
RFB kernel
Output: the number of reduced features (components).
If Apply automatically is ticked, changes will be propagated automatically. Alternatively, click Apply.
Produce a report.
Manifold Learning widget produces different embeddings for high-dimensional data.
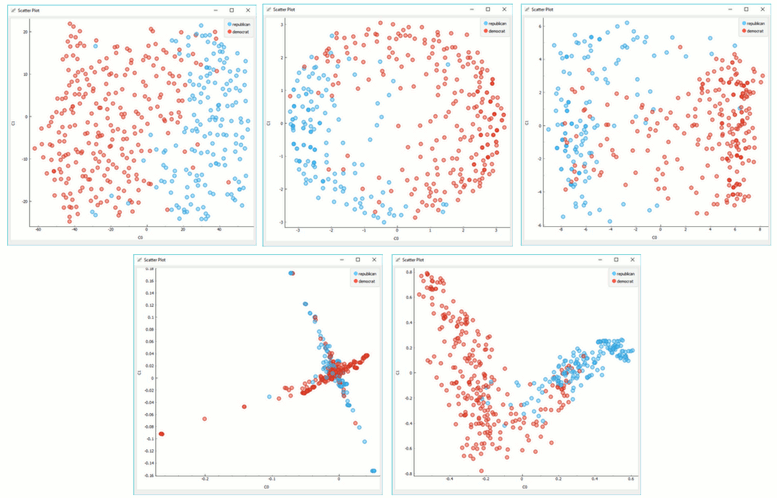
From left to right, top to bottom: t-SNE, MDS, Isomap, Locally Linear Embedding and Spectral Embedding.
Preprocessing
All projections use default preprocessing if necessary. It is executed in the following order:
continuization of categorical variables (with one feature per value)
imputation of missing values with mean values
To override default preprocessing, preprocess the data beforehand with Preprocess widget.
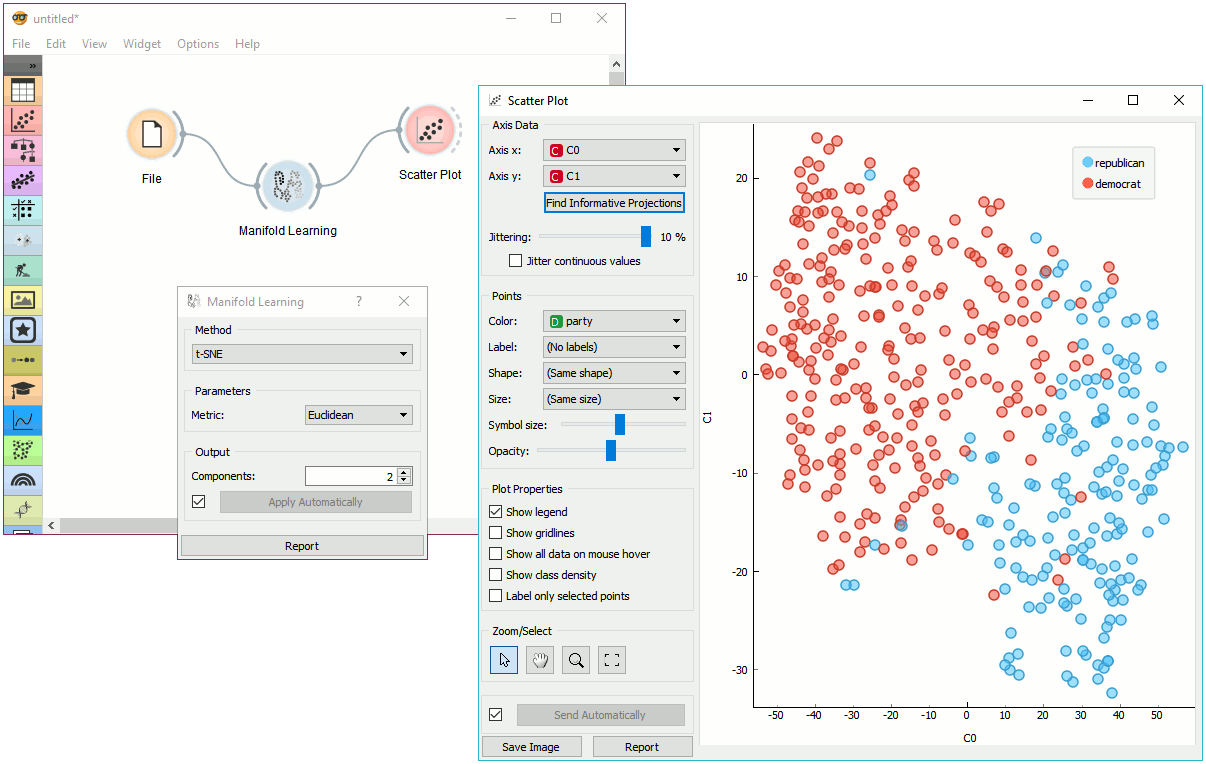
Example
Manifold Learning widget transforms high-dimensional data into a lower dimensional approximation. This makes it great for visualizing datasets with many features. We used voting.tab to map 16-dimensional data onto a 2D graph. Then we used Scatter Plot to plot the embeddings.